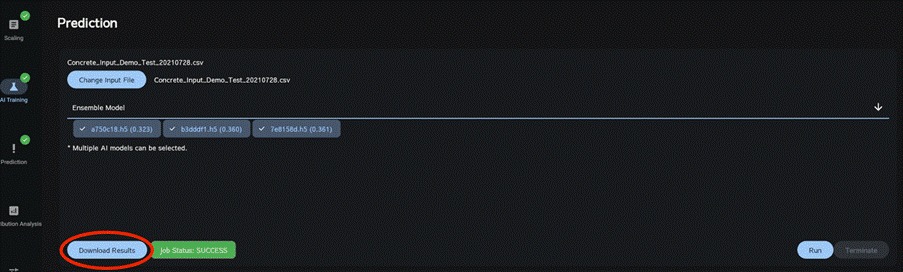
To predict the target variable for unknown explanatory variables, use AI Prediction.
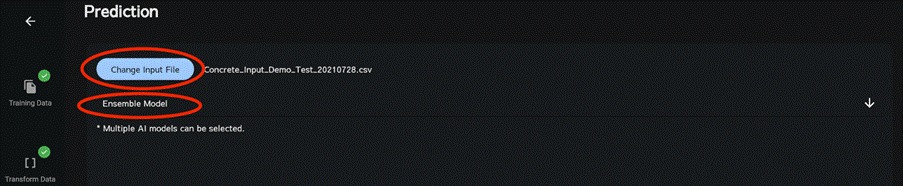
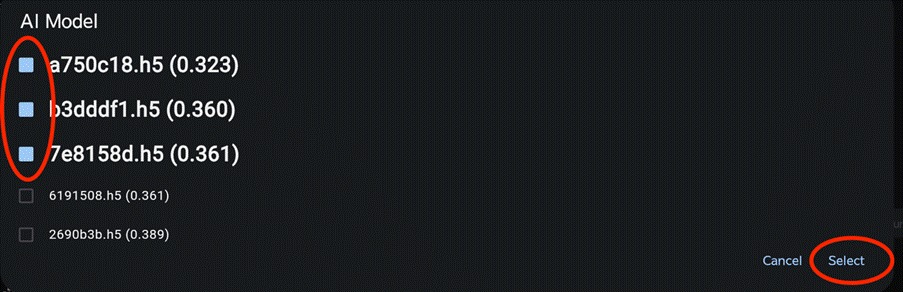
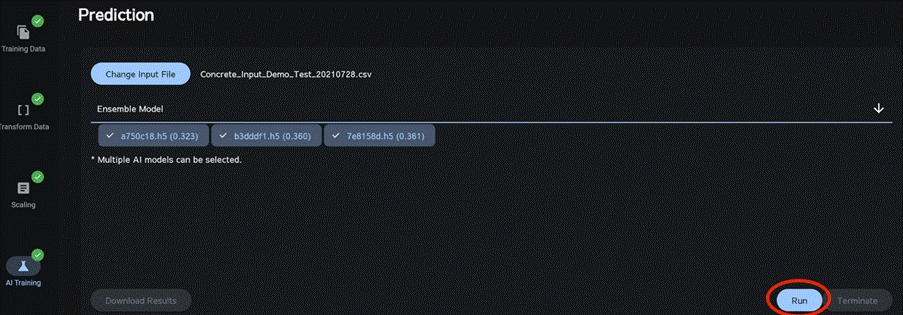
On the Prediction section, upload a CSV file listing the unknown explanatory variable values as the input file. Click “Ensemble Model” to select the multiple trained AI models, then click Run. The predicted values of the target variable for that list of explanatory variable values can be downloaded.
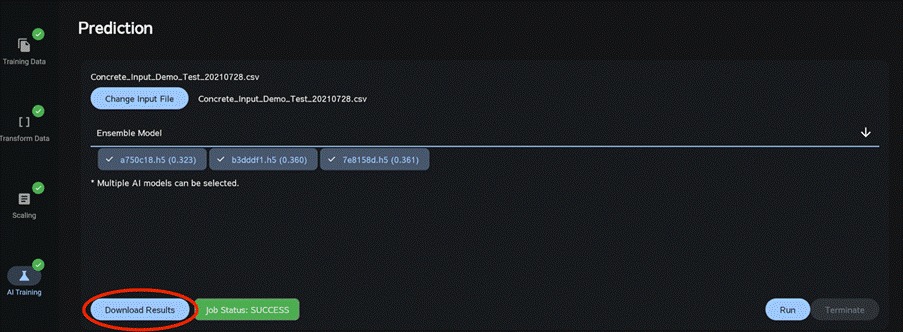
Note: The input file for AI prediction must contain the same column names as the input file used during AI training.
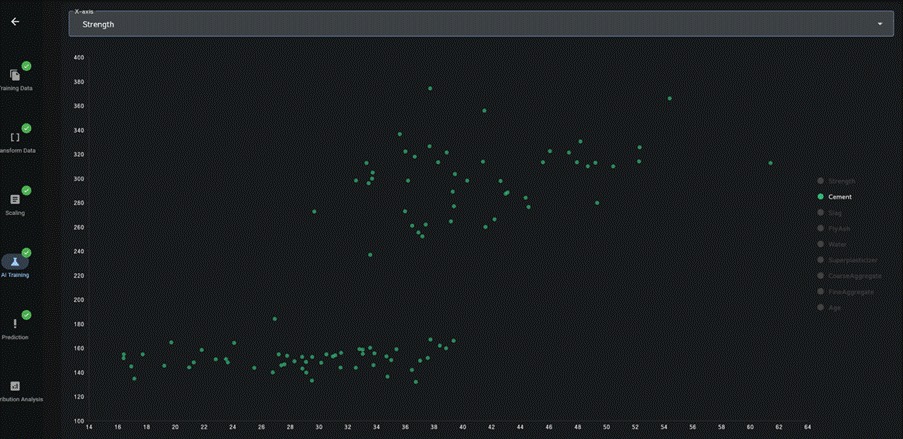
Select the x- and y-axis parameters to display the graph.
Once you have obtained actual results for the predictions, you can upload these results as a verification file. This will allow you to calculate the error between the predictions and the actual results.
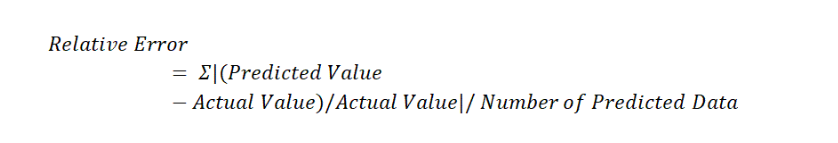
The error is calculated using the following formula, which is a relative error calculation. Therefore, when the actual value is close to zero, the model’s prediction will also be close to zero, but even a small absolute difference can result in a very large relative error.
Additionally, clicking “Download Results” will download the relative error, root mean square error (RMSE), and correlation coefficient.
If the prediction results are binary, the ROC curve is available for download. Click Download ROC to download it. (If the prediction results are not binary, the button will not be displayed.)