Once an AI model appears at the bottom of the AI Training screen, click Optimization in the left-hand sidebar to open the optimization screen.
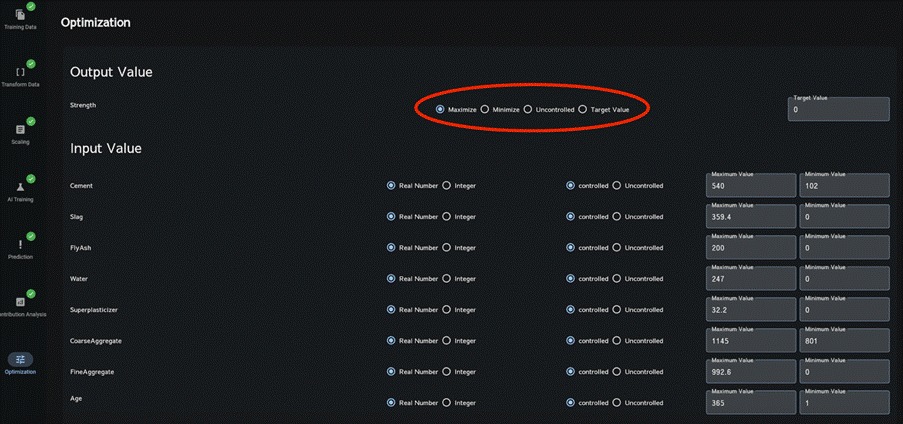
On the optimization screen shown below, for each objective (output value), choose Maximize / Minimize / Uncontrolled / Target Value. Then click Ensemble Model near the middle of the screen to select the AI model to use, and click Optimize at the bottom.
If Uncontrolled is selected, that objective is ignored during optimization.
If Target Value is selected, the search prioritizes solutions close to the number entered in the text field.
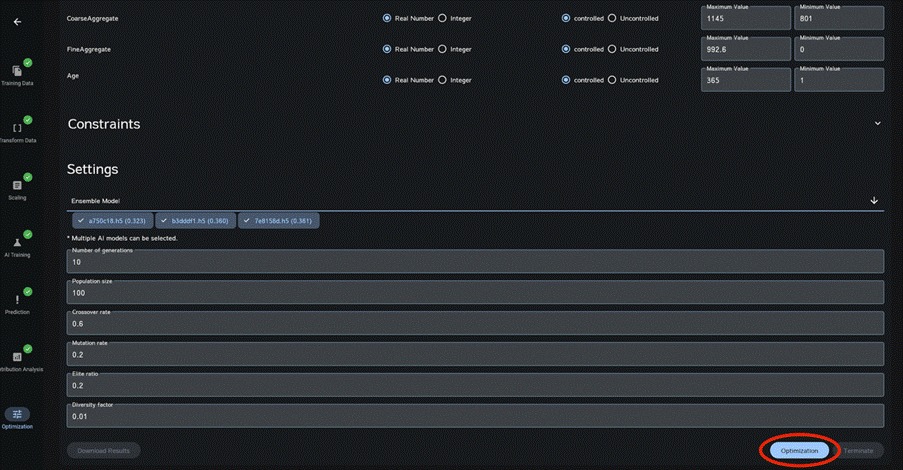
Other settings may be left at their defaults. However, if the number of objectives (output variables) is large or solution convergence is poor, adjust Number of Generations within the range of 10 to 100; increasing the number of generations may improve optimization accuracy.
Once the analysis is complete, “Download Results” will turn blue; click it (this may take about 1–2 minutes).
Select the x- and y-axis parameters to display the graph.
Note: Although maximum and minimum values outside the range of the uploaded explanatory variables may be entered for each explanatory variable, predictive accuracy is not guaranteed.
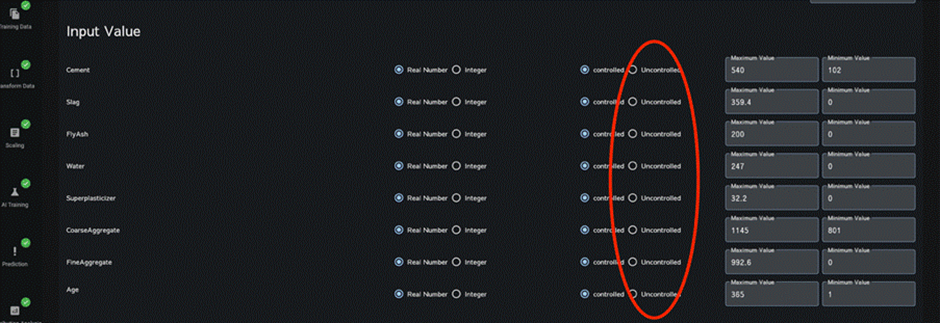
10.1 Allowing ranges for explanatory variables (inputs) #
If any explanatory variables (inputs) cannot be controlled, select Uncontrolled for those variables. The optimization will then be performed for the controlled explanatory variables under the assumption that each uncontrolled explanatory variable can take any value between its minimum and maximum.
Each row of the optimization-results CSV file also includes the maximum and minimum of each objective, computed under the controlled explanatory-variable settings recorded in that row, when the uncontrolled explanatory variables are allowed to vary from their minimum to their maximum.
10.2 Imposing constraints on explanatory variables (inputs) #
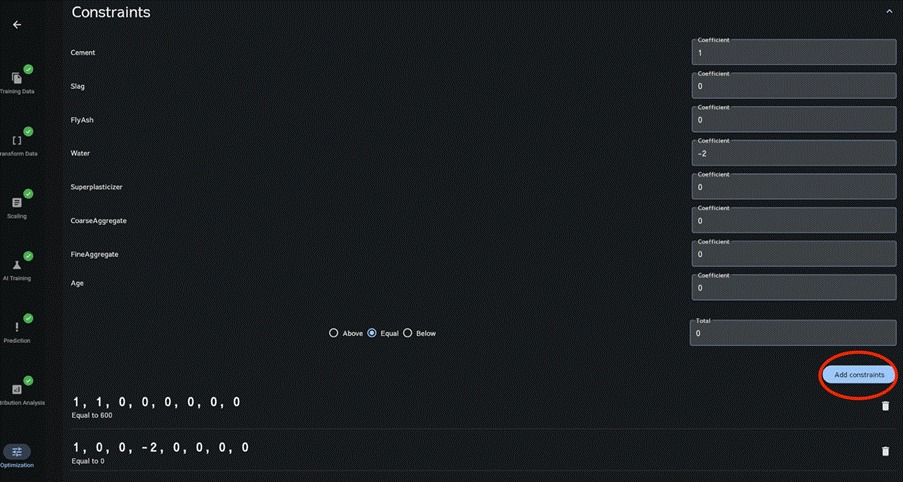
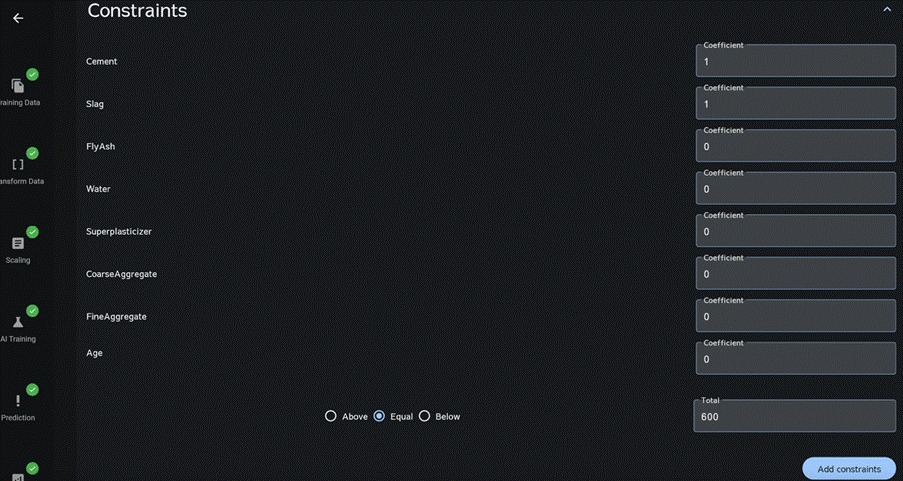
To impose constraints on the explanatory variables, click the section labeled Constraints. An input screen like the one below will open; enter the coefficients for each explanatory variable, the total value, and the relation to the total (Above/ Equal / Below). Explanatory variables with a coefficient of 0 are not constrained. The example below applies the constraint Cement × 1 + Slag × 2 = 600.
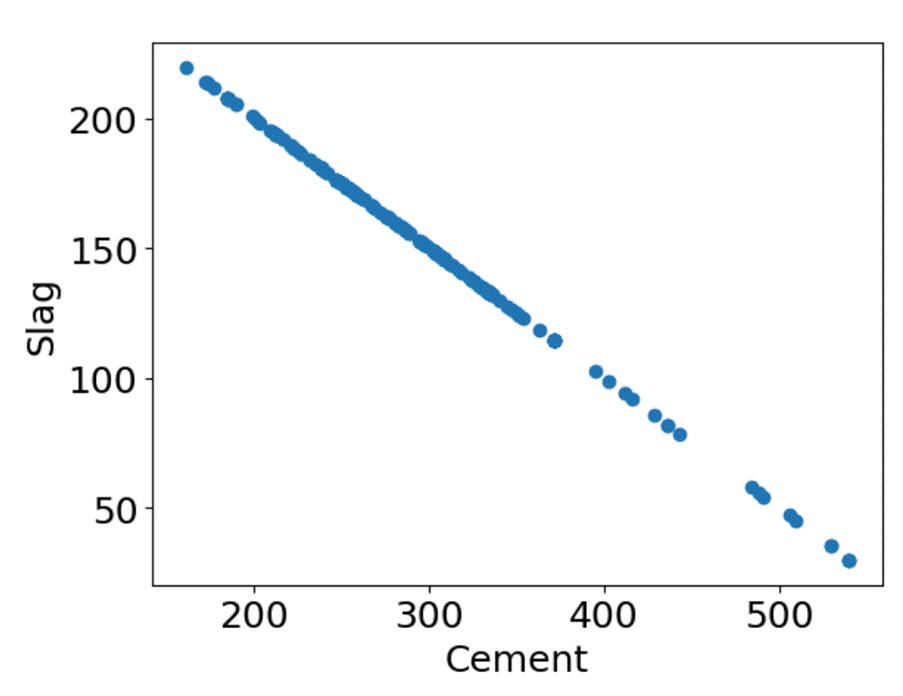
The figure below shows the downloaded results from running the optimization with constraints set. You can see that the search was conducted under conditions that satisfy those constraints.
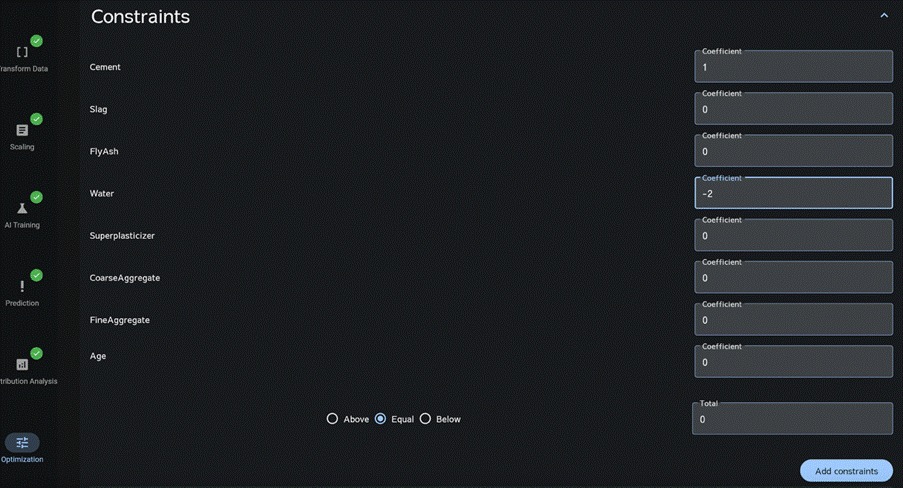
You can also specify negative values for the coefficients and the total.
The figure below shows an example where the constraint Cement × 1 − Water × 2 = 0 is applied.
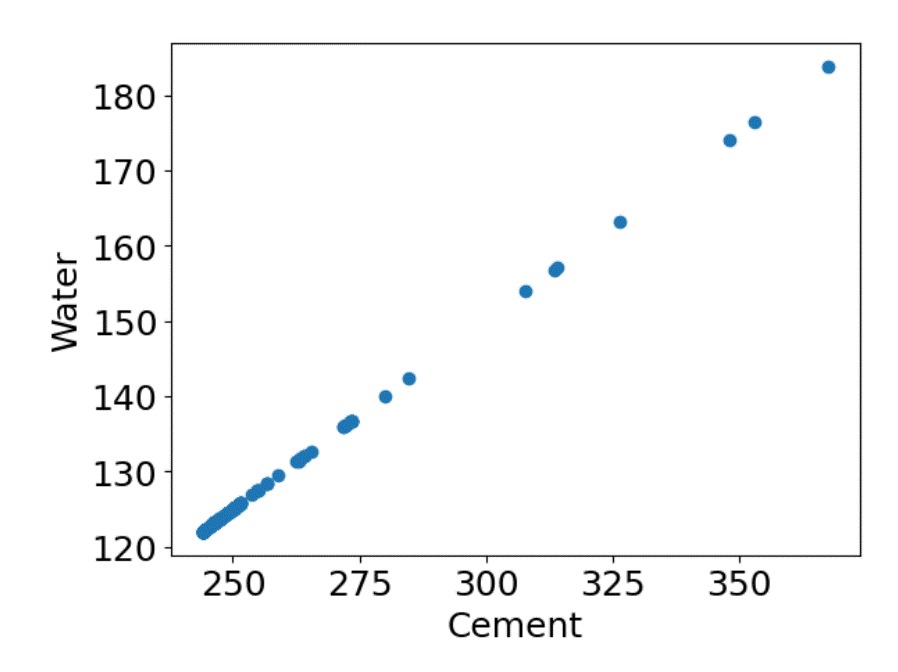
The figure below shows the downloaded results from running the search with constraints set. You can see that the search was conducted under conditions that satisfy those constraints.
However, note that if negative values are assigned to any coefficients or to the total, or if no feasible solution satisfies the constraints, the results may include outputs that do not meet the constraints.
Multiple constraints can be specified.
After configuring the constraints, click “Add Constraint.”
The constraint settings will be saved.