1.1 Visualization of AI model responses #
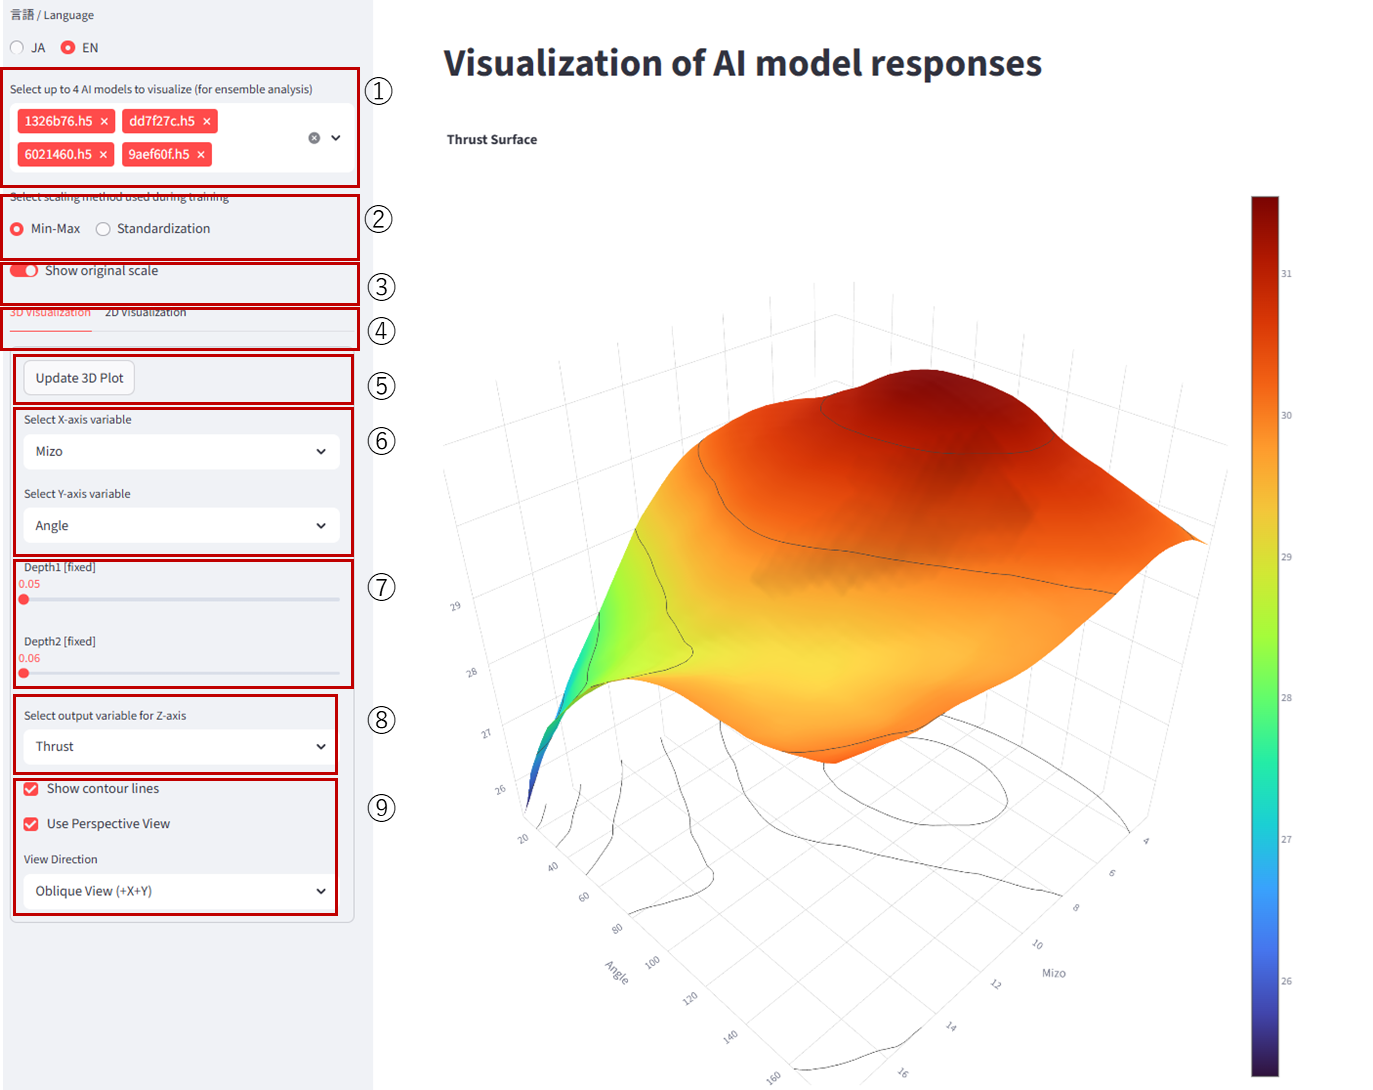
1.Select AI Model(s) to Visualize: Up to four ensemble models are supported. By default, the top four ensembles by accuracy are selected.
2. Select the scaling method used during training: This selection is required when “Display in Original Scale (see below)” is enabled. (Currently supported only when data are scaled with Batch Min-Max or Batch Standardization.)
3. Display in Original Scale: When enabled, outputs are displayed in the pre-scaling, original scale. (Correct conversion to the original scale is currently supported only for Batch Min–Max or Batch Standardization.)
4. Toggle Between 3D and 2D Visualization: Use the tabs to switch.
5. Update 3D plot: Click Update 3D Plot to refresh the display after changing settings.
6. X/Y Axes (Explanatory Variables): Select the explanatory (input) variables to assign to the X and Y axes.
7. Other Explanatory Variables: Set values for the remaining explanatory variables using sliders.
8. Z Axis (Objective Variable): Select the objective (output) variable to assign to the Z axis.
9. Display Settings: Configure visualization options. Click Update 3D Plot to apply changes.
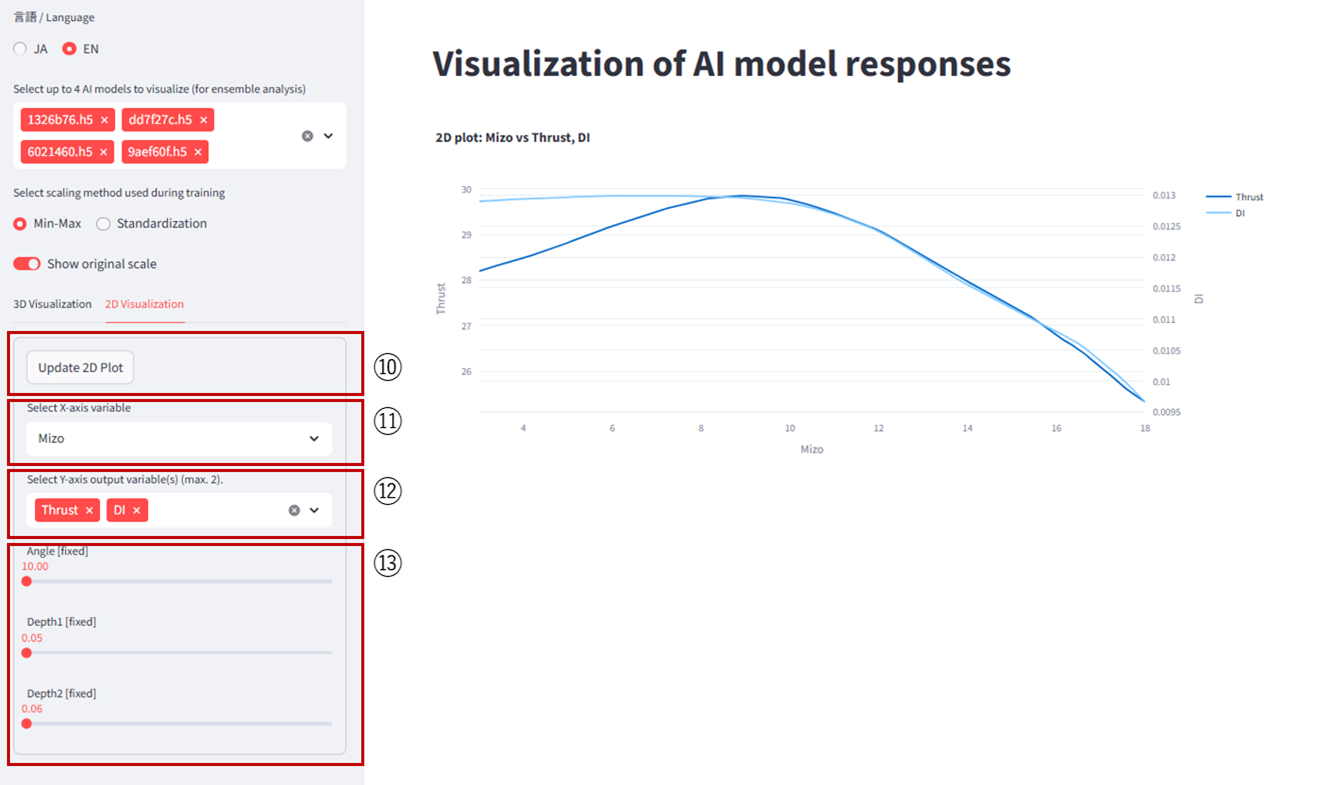
Click 2D Visualization to open the 2D menu shown above.
10. Update 2D Plot: Click to refresh the display after changing settings.
11. X Axis (Explanatory Variable): Select the explanatory (input) variable for the X axis.
12. Y Axis (Objective Variable): Select up to two objective (output) variables for the Y axis.
13. Other Explanatory Variables: Adjust the remaining explanatory variables with sliders.
1.2 Visualization of Monte Carlo Simulation Results #
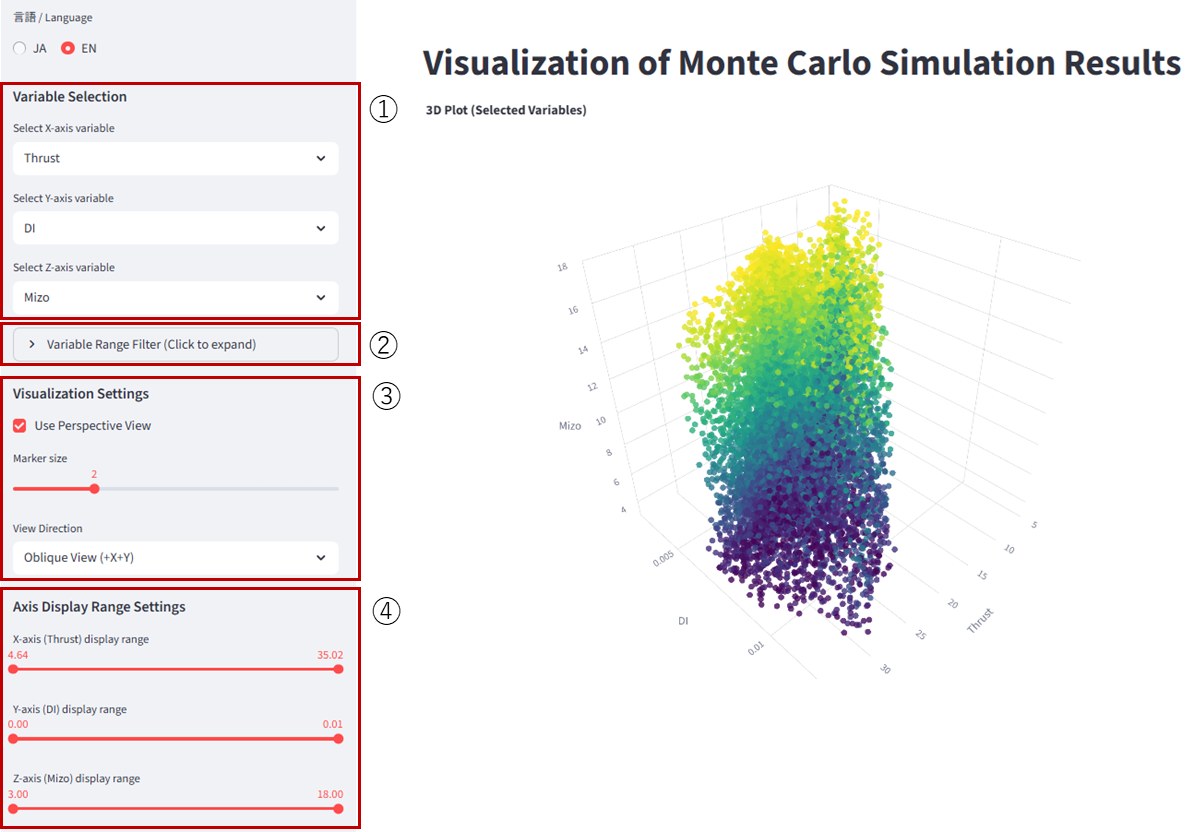
1. Axis Assignment: Select variables for the X, Y, and Z axes. If you have three or more objective variables, assign each objective to a different axis to inspect the distribution of solutions in 3D.
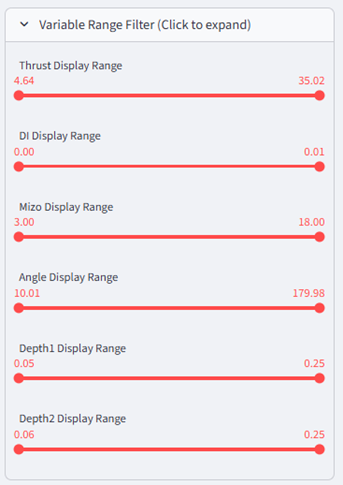
2. Variable Range Selection: Click to show range-selection sliders. Move the left and right markers to filter the plotted range. Only points within the markers’ range are displayed; values outside the range are hidden.
3. 3D Display Settings3D: Adjust visualization parameters for the 3D plot.
4. Axis Ranges: Set min/max axis ranges. The left marker sets the minimum; the right marker sets the maximum for each axis.
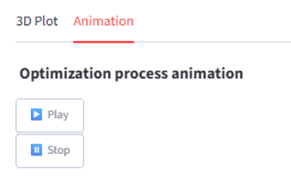
1.3 Visualization of Optimization Results #
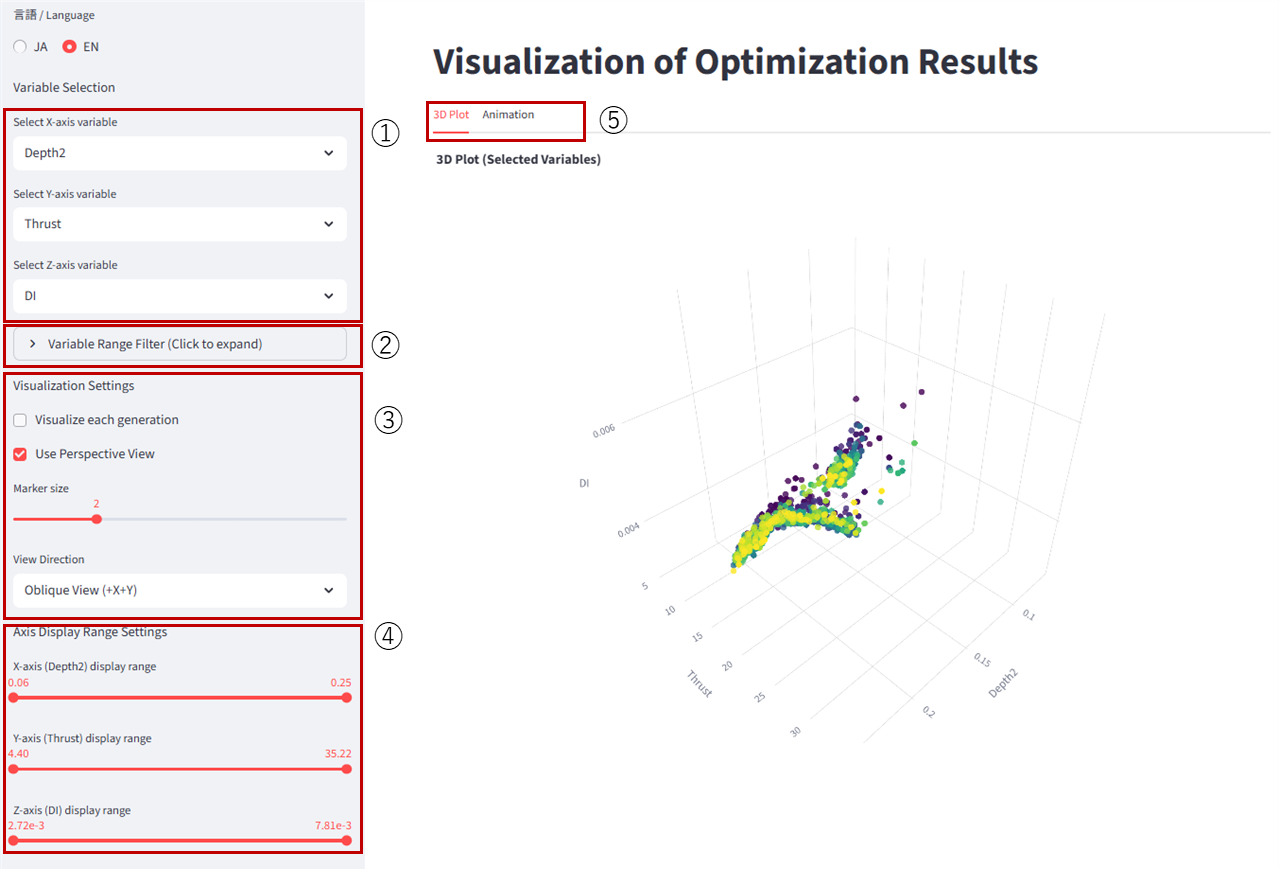
1. Axis Assignment: Choose variables for the X, Y, and Z axes. The variable Generation corresponds to the generation index of the optimization parameters.
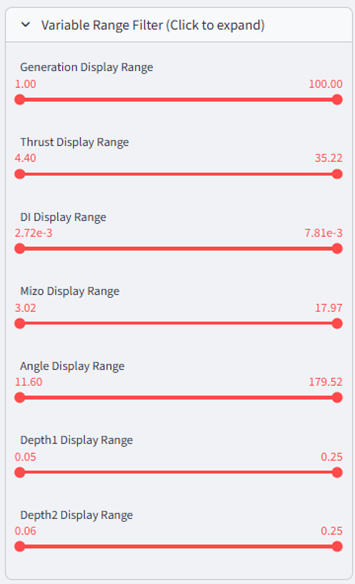
2. Variable Range Selection: Click to display the range-selection sliders. Move the left/right markers to filter the plotted variable ranges. Only values within the markers’ range are shown.
3. 3D Display Settings: Modify visualization parameters for the 3D plot.
4. Axis Ranges: Adjust axis min/max using the sliders. The left marker sets the minimum; the right marker sets the maximum.
5. Animation: From this tab, click Animation to reveal playback controls. Click Play to animate the plots for each generation up to the configured number of generations, allowing you to observe how the solution search progresses over time.